shell脚本监测web网页告警至飞书webhook
文件结构:
--- config.sh
--- feishu_push.sh
--- mgralertbot.sh
--- monitor.sh
--- logs
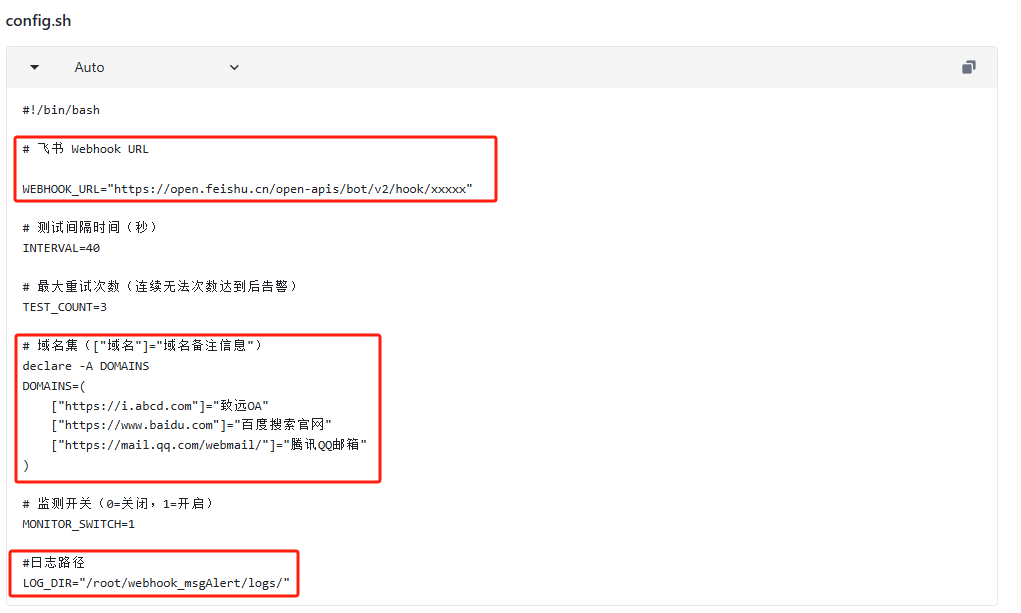
config.sh
#!/bin/bash

# 飞书 Webhook URL
#WEBHOOK_URL="https://open.feishu.cn/open-apis/bot/v2/hook/c38cd75e-64bc-4952-a597-270f0ad2ead3"
WEBHOOK_URL="https://open.feishu.cn/open-apis/bot/v2/hook/18e39a72-3b19-4762-b798-c00250fffc77"

# 测试间隔时间(秒)
INTERVAL=40

# 最大重试次数
TEST_COUNT=3

# 域名集(以空格分隔)
declare -A DOMAINS
DOMAINS=(
    ["https://www.baidu.com"]="百度搜索官网"
    ["https://www.taobao.com"]="淘宝官网"
    ["https://www.qq.com"]="qq官网"
)

# 监测开关(0=关闭,1=开启)
MONITOR_SWITCH=1

#日志路径
LOG_DIR="/root/webhook_msgAlert/logs/"
feishu_push.sh
#!/bin/bash

# 加载配置文件
source ./config.sh

# 确保日志目录存在
log_dir="$LOG_DIR"
mkdir -p "$log_dir"
log_file="$log_dir/logs_feishu_push"

# 飞书 Webhook URL
webhook_url="$WEBHOOK_URL"

# 从命令行获取系统名称和消息内容
system_name="${1:-'默认系统名称'}"  # 如果没有传入系统名称,则使用默认系统名称
message="${2:-'默认消息'}"  # 如果没有传入消息,则使用默认消息

# 当前时间戳
current_time=$(date '+%Y-%m-%d %H:%M:%S')

# 构建 JSON 数据
json_data=$(cat <<EOF
{
    "msg_type": "post",
    "content": {
        "post": {
            "zh_cn": {
                "title": "告警alert:",
                "content": [
                    [
                        {
                            "tag": "text",
                            "text": "系统名称: ${system_name}\n状态更新: ${message} "
                        },
                        {
                            "tag": "text",
                            "text": "\n推送时间: ${current_time}"
                        }
                    ]
                ]
            }
        }
    }
}
EOF
)

# 发送请求
response=$(curl -s -X POST "$webhook_url" \
-H "Content-Type: application/json" \
-d "$json_data")

# 将响应和时间保存到日志文件
 echo "[$current_time] Response: $response" >> "$log_file"

# 打印响应
 echo "Response: $response"
mgralertbot.sh
#!/bin/bash


# 加载配置文件
source ./config.sh

# 确保日志目录存在
log_dir="$LOG_DIR"

# 定义监测脚本和日志文件的名称
SCRIPT_NAME="/root/webhook_msgAlert/monitor.sh"
LOG_FILE="$LOG_DIR/logs_monitor"

# 函数:启动监测脚本
start_monitor() {
    if pgrep -f "$SCRIPT_NAME" > /dev/null; then
        echo "$SCRIPT_NAME 已经在运行。"
    else
        nohup "$SCRIPT_NAME" > "$LOG_FILE" 2>&1 &
        echo "$SCRIPT_NAME 已启动,输出日志到 $LOG_FILE"
    fi
}

# 函数:查看监测脚本状态
status_monitor() {
    if ps aux | grep -v grep | grep "monitor.sh" > /dev/null; then
        echo "$SCRIPT_NAME 正在运行。"
        echo "进程信息:"
        ps aux | grep -v grep | grep "monitor.sh"
        echo "日志内容:"
        tail -n 20 "$LOG_FILE"  # 显示日志的最后20行
    else
        echo "$SCRIPT_NAME 没有在运行。"
    fi
}

# 函数:关闭监测脚本
stop_monitor() {
    if pgrep -f "monitor.sh" > /dev/null; then
        pkill -f "monitor.sh"
        echo "$SCRIPT_NAME 已关闭。"
    else
        echo "$SCRIPT_NAME 没有在运行。"
    fi
}

# 主菜单循环
while true; do
    echo "请选择操作:"
    echo "1. 启动监测脚本"
    echo "2. 查看监测脚本状态"
    echo "3. 关闭监测脚本"
    echo "0. 退出"

    read -p "输入选项 (1-4): " option

    case $option in
        1)
            start_monitor
            ;;
        2)
            status_monitor
            ;;
        3)
            stop_monitor
            ;;
        0)
            echo "退出。"
            exit 0
            ;;
        *)
            echo "无效选项,请输入 1-4。"
            ;;
    esac

    echo ""  # 输出一个空行,增加可读性
done
monitor.sh
#!/bin/bash

# 加载配置文件
source ./config.sh

# 确保日志目录存在
log_dir="$LOG_DIR"
mkdir -p "$log_dir"
log_file="$log_dir/logs_monitor"


# 初始化状态、失败计数器和告警状态
declare -A current_status
declare -A failure_count
declare -A alert_sent

for domain in "${!DOMAINS[@]}"; do
    current_status["$domain"]="reachable"
    failure_count["$domain"]=0
    alert_sent["$domain"]=false  # 初始化告警状态为未发送
done

# 日志记录函数
log() {
    echo "$(date '+%Y-%m-%d %H:%M:%S') - $1" >> "$log_file"
}

while true; do
    # 重新加载配置文件以获取最新的 MONITOR_SWITCH
    source ./config.sh

    # 检查监测开关
    if [ "$MONITOR_SWITCH" -eq 0 ]; then
        echo "监测已关闭,退出循环。"
        log "监测已关闭,退出循环。"
        break
    fi

    for domain in "${!DOMAINS[@]}"; do
        # 使用 curl 检查 HTTP 状态码
        http_status=$(curl -o /dev/null -s -w "%{http_code}" "$domain" 2>/dev/null)

        if [ $? -ne 0 ]; then
            ((failure_count["$domain"]++))  # 计入无法连接次数
            http_status="0"  # 将状态码设为 0 表示请求失败
            log "无法连接到 $domain,状态码: $http_status"
        fi

        if [ "$http_status" -eq 200 ]; then
            failure_count["$domain"]=0  # 重置失败计数器

            if [ "${current_status["$domain"]}" == "unreachable" ]; then
                if [ "${alert_sent["$domain"]}" == true ]; then
                    ./feishu_push.sh "${DOMAINS[$domain]}" "系统恢复正常✅"
                    alert_sent["$domain"]=false  # 重置告警状态
                    log "域名 $domain 恢复正常,已发送告警。"
                fi
                current_status["$domain"]="reachable"  # 更新状态
            fi
        else
            ((failure_count["$domain"]++))  # 增加失败计数器
            log "域名 $domain 检测到异常,状态码: $http_status"

            if [ "${failure_count["$domain"]}" -ge "$TEST_COUNT" ]; then
                if [ "${current_status["$domain"]}" == "reachable" ]; then
                    ./feishu_push.sh "${DOMAINS[$domain]}" "检测到异常(状态码: $http_status),请注意检查服务器状态!❌"
                    current_status["$domain"]="unreachable"  # 更新状态
                    alert_sent["$domain"]=true  # 设置告警状态为已发送
                    log "域名 $domain 状态变为不可达,已发送告警。"
                fi
            fi
        fi
    done

    sleep "$INTERVAL"
done
配置启用脚本
配置飞书webhook ,监控的域名和名称,以及日志目录
输入以下命令进行启用监控
./mgralertbot.sh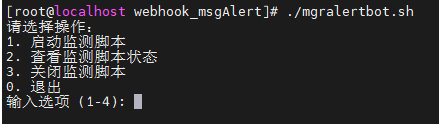
- 感谢你赐予我前进的力量
-
 微信
微信  支付宝
支付宝
赞赏者名单
因为你们的支持让我意识到写文章的价值🙏
本文是原创文章,采用CC BY-NC-ND 4.0协议,完整转载请注明来自 halo.taofile.cn。

评论
匿名评论
隐私政策
你无需删除空行,直接评论以获取最佳展示效果